LogCpTransformer#
The LogCpTransformer() applies the transformation log(x + C), where C is a
positive constant.
You can enter the positive quantity to add to the variable. Alternatively, the transformer will find the necessary quantity to make all values of the variable positive.
Example#
Let’s load the California housing dataset that comes with Scikit-learn and separate it into train and test sets.
import pandas as pd
import matplotlib.pyplot as plt
from sklearn.model_selection import train_test_split
from sklearn.datasets import fetch_california_housing

from feature_engine.transformation import LogCpTransformer

# Load dataset
X, y = fetch_california_housing( return_X_y=True, as_frame=True)

# Separate into train and test sets
X_train, X_test, y_train, y_test =  train_test_split(
    X, y, test_size=0.3, random_state=0)
Now we want to apply the logarithm to 2 of the variables in the dataset using the
LogCpTransformer(). We want the transformer to detect automatically the
quantity “C” that needs to be added to the variable:
# set up the variable transformer
tf = LogCpTransformer(variables = ["MedInc", "HouseAge"], C="auto")

# fit the transformer
tf.fit(X_train)
With fit() the LogCpTransformer() learns the quantity “C” and stores it as
an attribute. We can visualise the learned parameters as follows:
# learned constant C
tf.C_
{'MedInc': 1.4999, 'HouseAge': 2.0}
Applying the log of a variable plus a constant in this dataset does not make much sense because all variables are positive, that is why the constant values C for the former variables are possible.
We will carry on with the demo anyways.
We can now go ahead and transform the variables:
# transform the data
train_t= tf.transform(X_train)
test_t= tf.transform(X_test)
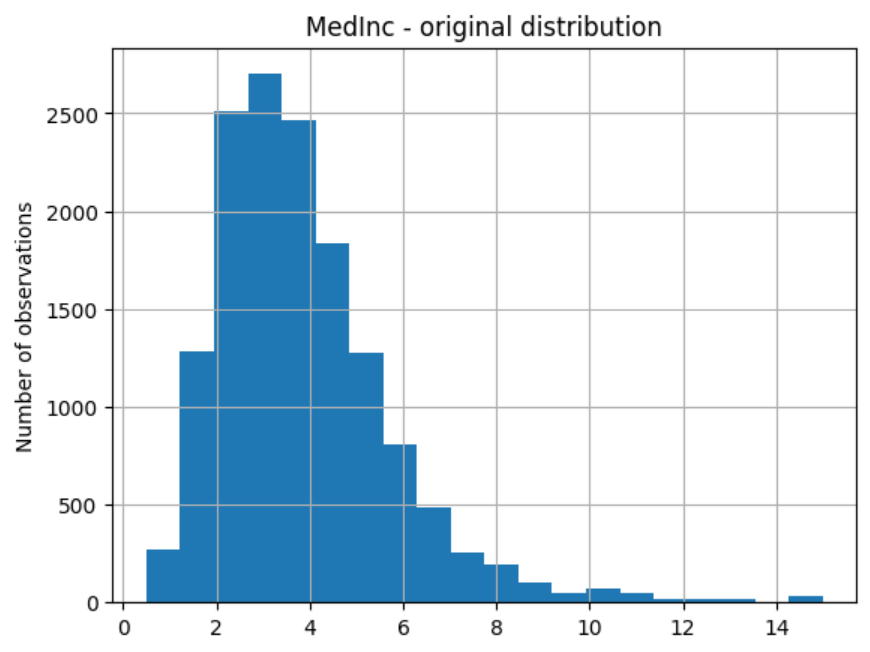
Then we can plot the original variable distribution:
# un-transformed variable
X_train["MedInc"].hist(bins=20)
plt.title("MedInc - original distribution")
plt.ylabel("Number of observations")
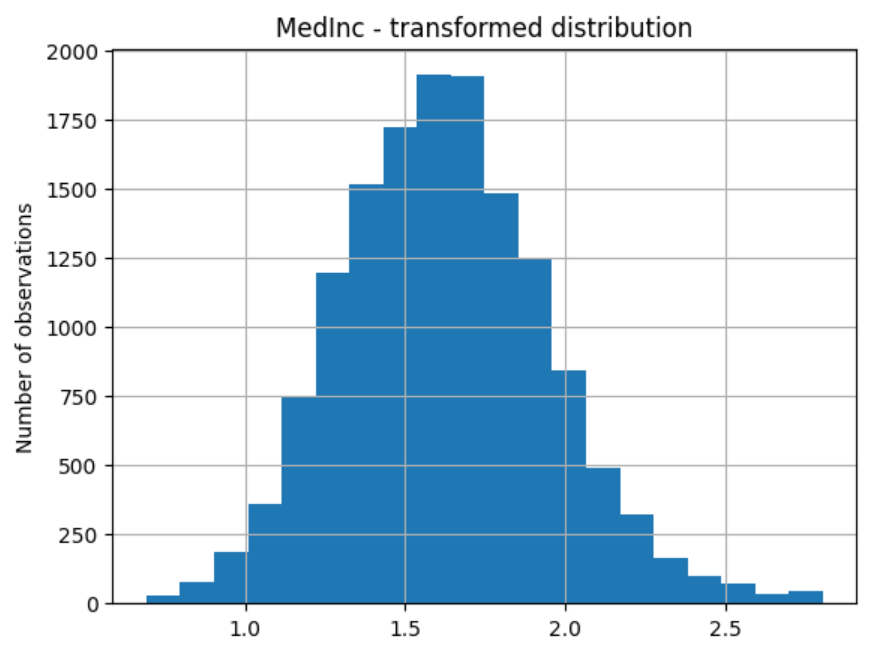
And the distribution of the transformed variable:
# transformed variable
train_t["MedInc"].hist(bins=20)
plt.title("MedInc - transformed distribution")
plt.ylabel("Number of observations")
Tutorials, books and courses#
You can find more details about the LogCpTransformer() here:
For tutorials about this and other data transformation methods, like the square root transformation, power transformations, the box cox transformation, check out our online course:

Feature Engineering for Machine Learning#
Or read our book:
Python Feature Engineering Cookbook#
Both our book and course are suitable for beginners and more advanced data scientists alike.